

While the average stock in the sector yields a modest 3.5%, a payout surging above 8% instantly captures the attention of yield-focused investors.
Spotting a $40.00 stock offering an annual distribution of $3.40 feels like stumbling onto an overlooked bargain. Yet an 8.5% yield is rarely a gesture of corporate generosity. More often, that headline percentage spikes because the underlying share price has suffered a steep collapse, turning what looks like an attractive income stream into a red flag of deep structural trouble.
Instead of signaling an easy win, a payout at that level warns that the business may be struggling to keep its promises. Learning to look past the optical appeal allows you to evaluate cash flows, debt obligations, and coverage metrics before risking a single dollar.
At a Glance
Falling Stock Prices Drive Yields Up
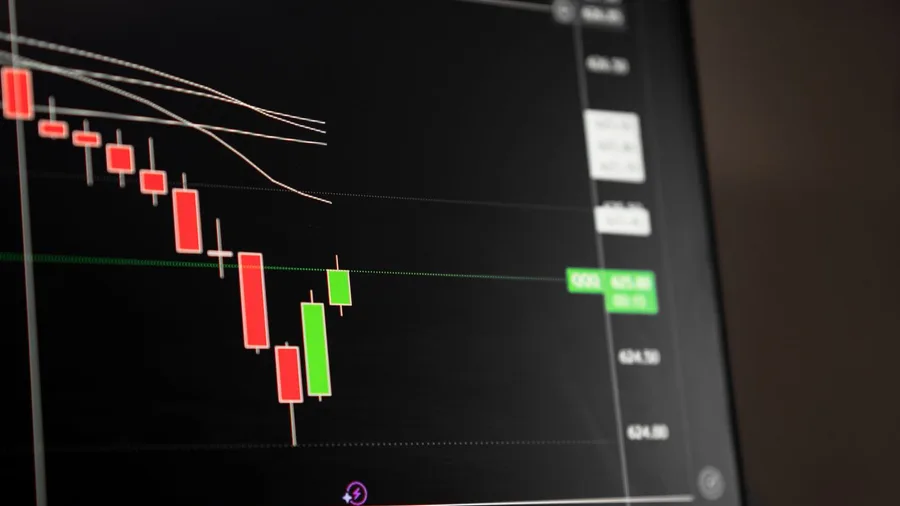
A soaring yield percentage is simply a mathematical reflection of a collapsing share price rather than a sign of corporate health. Because dividend yield is calculated by dividing the annual cash payout by the current trading price, any downward movement in the stock automatically pushes the headline percentage higher. When a company slides down from a $70 share price to a $40 price point, the optical yield illusion expands dramatically while the underlying business fundamentals quietly deteriorate.
Many income-focused buyers fall straight into the psychological trap of seeing an eye-catching 8.5% yield without ever checking the wider price history or asking why the stock dropped from $70 in the first place. The baseline figures show a $40.00 stock price paired with a $3.40 annual dividend producing that stated 8.5% yield, masking the heavy losses shareholders already absorbed on the principal.
Chasing that elevated return without investigating the path the stock took to get there often leaves investors holding a declining asset where the dividend is the only reason left to stay.
| Metric | Sustainable High Yield | Value Trap (Above 8%) |
|---|---|---|
| Stock Price | Stable or Rising | Collapsing ($40.00) |
| Annual Dividend | Covered by Earnings | $3.40 per share |
| Stated Yield | 4.5% to 6.0% | 8.5% |
| Debt-to-Equity | Below 1.0 | 2.1 |
Earnings Do Not Support the Payout

When a stock's price depreciation distorts the yield upward, the immediate question turns to whether the underlying earnings of the business can actually support the cash going out the door. The $3.40 annual dividend distributed to shareholders exceeds the trailing twelve months earnings per share of $3.00, creating an immediate mathematical mismatch.
A payout ratio sitting above 100 percent signals a severe operational warning because the company is actively paying out more cash than it brings in through net income, threatening immediate unsustainability. Declining net income forces corporate management into a tight corner where they must choose between cutting the beloved dividend or taking on expensive debt just to cover the shortfall.
The business is forced to burn through its accumulated capital reserves simply to maintain the $3.40 distribution against a meager $3.00 in actual earnings, borrowing against tomorrow to pay today.
⚠️ COMMON MISTAKE
Ignoring the Payout Ratio Trap
Never assume a high dividend is safe just because the company paid it last quarter. If earnings sit below the total payout, the dividend is on borrowed time.
Cash Flow Deficits Outpace Earnings

Free cash flow per share sits at $2.50, trailing well behind the $3.00 earnings per share reported on the income statement.
Paying a $3.40 dividend from only $2.50 in actual free cash flow creates a direct cash deficit of $0.90 per share every single period.
That missing money has to come from somewhere, forcing the company to drain accumulated reserves, sell off valuable assets, or borrow new funds just to bridge the gap.
Standard accounting profits frequently mask the literal cash shortage required to fund upcoming dividend checks.
Paper earnings mean little when the bank account sits empty.
The Yield Trap Diagnostic
🧮 The True Payout Ratio
Divide dividends by free cash flow, not earnings. A safe buffer stops at 80%.
📊 The Sector Baseline
Compare against competitors. If the industry averages 3.5%, a massive yield is a warning.
⚖️ The Leverage Check
Look up Debt-to-Equity. At 2.1, this company has already maxed out its borrowing room.
Skip This Stock If
The share price sits at $40.00 while the yield stays at 8.5%. The market has already priced in a cut.
Heavy Debt Loads Strain Liquidity

Heavy corporate borrowing directly undermines the security of a shareholder payout when cash reserves shrink and interest payments mount.
A total debt-to-equity ratio of 2.1 serves as a stark mathematical indicator of severe financial stress, showing that the company relies heavily on borrowed capital rather than organic profits to keep doors open.
When obligations swell, every dollar spent servicing interest rates directly competes with the funds needed to maintain that $3.40 distribution.
Management faces an unavoidable choice as obligations mature, and lenders demand repayment before equity holders see a dime.
Credit rating downgrades loom large when balance sheets weaken this severely, threatening to trigger immediate liquidity crunches that freeze everyday operations and halt projects.
Corporate leadership must ultimately prioritize basic debt service over shareholder returns, placing the current dividend at extreme risk of reduction or outright elimination before the fiscal year closes.
Debt Diagnostics — The 4 Balance Sheet Checks
The Market Prices in an Inevitable Cut

Institutional investors ignore seemingly attractive yields because the broader market prices in an impending payout reduction well before retail buyers notice the drop.
An unusually high yield functions as a severe market discount rate that reflects extreme underlying risk rather than a free bonus handed out by generous executives.
Professional portfolio managers continuously sell off shares early to protect capital, keeping the stock price depressed and the yield artificially elevated because everyone expects a reduction.
When the official announcement finally arrives, it typically triggers an immediate downward reaction in the share price as remaining hopeful buyers rush to exit.
The current 8.5 percentage point return completely dwarfs the 3.5 industry average, highlighting a glaring market anomaly that signals deep corporate distress rather than an overlooked bargain.
💡 PRO TIP
Read the Market Sentiment
When a stock yields twice its industry average, institutional sellers already know a cut is coming. Treat the high yield as a red flag, not an invitation.
Distinguishing Cyclical Slumps from Structural Declines

Evaluating whether a high yield represents a temporary dip or a permanent failure requires separating broader sector movements from internal operational mistakes.
Core industry demand must be weighed carefully against company-specific productivity losses to determine if the business can generate actual profit in future quarters.
A temporary commodity price cycle differs fundamentally from a permanent loss of competitive advantage where customers abandon the brand for superior alternatives.
Corporate management commentary often displays specific qualitative warning signs of denial regarding structural declines, masking deep operational decay behind optimistic talking points.
Investors must look past the initial optical appeal and assess whether true earnings power will eventually recover or continue deteriorating permanently.
Value Trap Diagnostic Costs
Assumptions based on historical value trap performance profiles.
Frequently Asked Questions
Why is an 8% dividend yield considered dangerous?
An 8% yield usually happens because a company's stock price has plummeted due to severe financial distress. When the price drops, the fixed dividend payment represents a much higher percentage, signaling that the market expects the payout to be cut.
What is a payout ratio and why does it matter?
The payout ratio measures the percentage of earnings a company pays out as dividends. If the ratio exceeds 100 percent, the company is paying out more than it earns, which is unsustainable without taking on debt or burning reserves.
How can I tell if a high dividend is sustainable?
You must check the free cash flow per share alongside earnings. If free cash flow exceeds the dividend payment and the company maintains a manageable debt load, the payout is much more likely to survive.
What happens when a company cuts its dividend?
When a company announces a dividend cut, income-focused investors typically sell their shares immediately. This wave of selling drives the stock price down further, resulting in both lost income and capital losses.
Evaluating 8 Percent Yields Through Systematic Triage
Before committing capital, run a strict triage: verify if a falling stock price inflated the yield, compare the payout against free cash flow per share, and confirm that debt obligations will not force an immediate dividend cut.
That initial temptation of buying an 8.5% payout on a $40.00 stock vanishes the moment cash generation falls short of the commitment.
An eye-popping yield that doubles the 3.5% industry average is a market warning, not free money. Demanding proof of cash coverage before buying is the one move that keeps your income strategy intact.
Run the Numbers on Your Portfolio Today
Review your high-yield holdings against the cash flow and debt metrics outlined above to spot potential traps before they impact your income.